Platform Features
Everything You Need to Build
Professional NinjaTrader® Indicators & Automated Strategies
The Fusion Indicator System is not a single tool. It’s a full visual development environment for building NinjaTrader® 8 indicators and strategies.
425+ core operations · 500+ total with Order Flow+
Fusion Indicators is an independent software developer and is not affiliated with, endorsed by, or approved by NinjaTrader Group, LLC. NinjaTrader® is a registered trademark of NinjaTrader Group, LLC.
What It Does
205 Signal Processors. 50 Math Operations. 88 Logic Routes. 84 Strategy Controls.
Every number below represents a distinct operation class or input category, with no filler or bundled feature padding.
Core operations are available to every Fusion user. Order Flow+ inputs and operations require NinjaTrader® Order Flow+ access and are listed separately.
Native Order Flow+ (Optional)
+88 Order Flow+ Inputs & Operations
22 raw Order Flow+ metrics, 36 Order Flow math operations, and 30 analytics methods.
Requires NinjaTrader® Order Flow+ access. Order Flow+ is a feature of the NinjaTrader® platform and is not included with Fusion.
Browse the full Operation Library: every operation by name →
Visual Development
Build Indicators & Strategies Without Code
Building a custom indicator in NinjaTrader® normally means working in NinjaScript, its C# development framework for indicators, market data, charts, strategies, and orders. AI can help write that code, but each change still has to be reviewed, compiled, and tested inside the platform. NinjaTrader® Strategy Builder organizes strategy rules through a sequence of point-and-click screens; it does not provide an equivalent builder for indicators. Fusion brings indicator design and strategy design into one visual block-wiring workflow. Connect indicators, transform their plot values with math and processing blocks, add conditions and gates, and wire the resulting signals to Entries and Exits. As the design changes, the connected plots and signals update on the chart. The same design can progress from creating a signal to running it as an automated trading strategy, without rebuilding the logic in a separate tool.
CANVAS
Wire Values Into Trading Logic
Place indicators on the canvas, wire their plot values through Math and Signal Processor blocks, then route the results into plots, Conditions, Gates, State Machines, Entries, and Exits. The full path from indicator value to trading action stays visible in one visual workspace.
LIVE
Live Plot and Signal Feedback
Watch plots and Signal Viz respond on the NinjaTrader® chart as you wire. Review long, short, neutral, Entry, Exit, and flatten states, plus supported stop-loss, take-profit, trailing-stop, and multi-entry previews. Ordinary wiring changes need no compile cycle. A newly added secondary data series or certain indicator dependencies may need one reload. Builder flags the requirement and provides an on-screen Reload / F5 button.
PORTABLE
One Design, One Template Key
Build and refine indicator and strategy logic in Builder, then generate a Template Key containing the runnable logic. Fusion Indicator reads the key to calculate and display the design; Fusion Strategy reads it to run the strategy. Subscription access is required to create or edit keys. Completed keys can continue running on your installed versions of Fusion Indicator and Fusion Strategy after access ends, so you do not have to renew solely to run finished work. Compatibility, technical limits, and the Terms of Service apply.
EXPORT
Local Export for AI Studio
Select the Builder outputs and OHLCV fields you need, including intermediate block values, and capture them to a local CSV. AI Studio and Fusion ML Trainer use that dataset to train an ONNX model on your computer. Load the model back into Builder, where its output becomes another value you can plot or wire into the same NinjaTrader® workflow. The dataset, training process, and model files stay on your local machine. See Terms of Service.
Power Feature
Multi-Series &
Multi-Timeframe Support
A core Fusion Builder capability, this lets you add a secondary data series to your canvas, a different timeframe of the same instrument or an entirely different instrument, and incorporate it directly into your formula.
→
Add a 5-minute NQ series to a 1-minute ES primary chart
Add a 5-minute NQ series to a 1-minute ES primary chart
→
Incorporate VIX, TICK, ADD, DECL as secondary inputs
Incorporate VIX, TICK, ADD, DECL as secondary inputs
→
Apply any built-in indicator to any series in the same formula
Apply any built-in indicator to any series in the same formula
→
Combine them all in one visual pipeline
Combine them all in one visual pipeline
Primary Series
ES MAR26 · 1 Minute
Secondary Series #1
NQ MAR26 · 5 Minute
Secondary Series #2
$VIX · 1 Day
Unique Capability
One-Click Price Chart Toggle
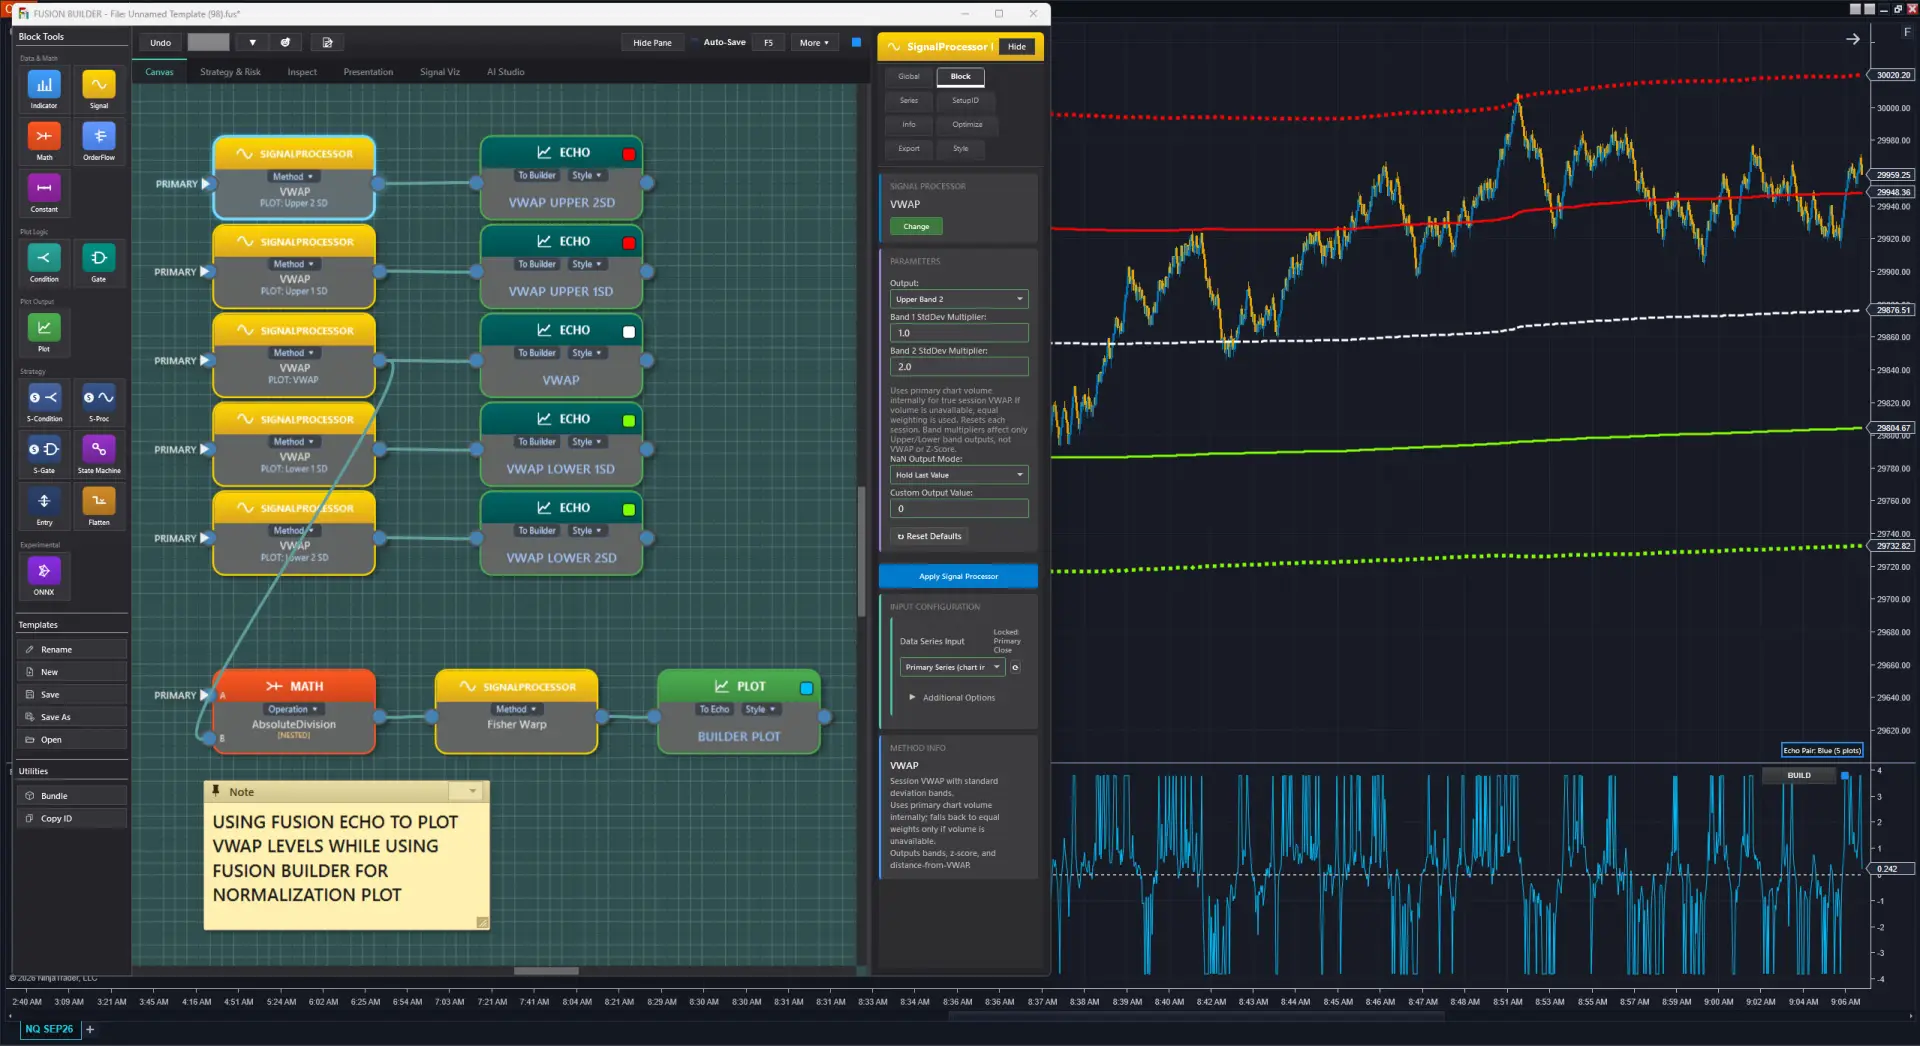
Fusion Echo renders your indicator output on both the price chart and a separate indicator panel at the same time, in the same chart window. The price chart view is price-scale synchronized, so you see directly how your indicator values relate to actual price levels.
Run multiple Builder + Echo pairs on the same chart. Each pair shares one color, so you always know which line came from which canvas.
Visual Simulator
See Your Strategy Before You Build It
Fusion Signal is a visual strategy simulator that approximates how your strategy will behave while you’re still in the development phase, with no automation required. You’ll see buy and sell signals, stop losses, trailing stops, profit targets, flatten conditions, and ghost signals painted directly on your chart as you build.
Racing stripes appear on your price chart showing signal events, while the full histogram and signal details render in a separate panel, just like Fusion Echo. Your Builder panel stays free for indicator math. Both layers update live as you adjust your logic.
⚠️ Simulator Disclaimer
Fusion Signal is a visual approximation only. Live automated strategies can always behave differently. Always backtest and run in simulation mode before deploying any automated strategy.
FUSION SIGNAL: DUAL PANEL ARCHITECTURE
▲ PRICE CHART: RACING STRIPES
Buy signals · Sell signals · Entry markers
Overlaid on price · Stays with price bar
▼ SEPARATE PANEL: HISTOGRAM & SIGNALS
Stop losses · Trailing stops · Profit targets
Flatten · Ghost signals · Long/short entries
🔧 BUILDER PANEL: FREE FOR MATH
Indicator wiring stays unaffected
Signal visualization is fully independent
Live Wire Heads-Up Display (HUD): See Your Strategy Think
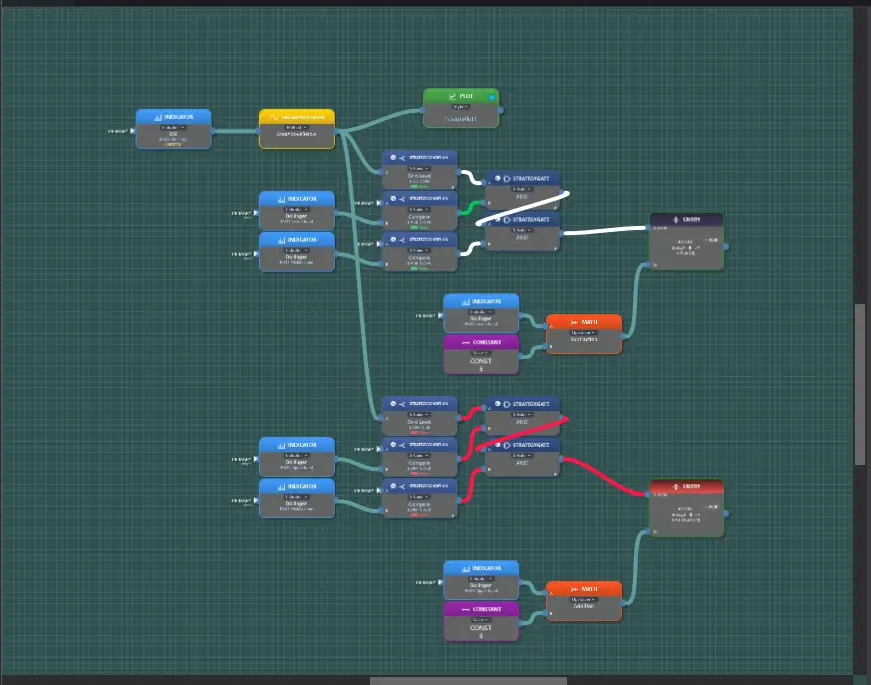
Strategy wires on the canvas are a live heads-up display (HUD): green = long, red = short, white = neutral. Watch every strategy block’s output change in real time, and see instantly why a gate resolved the way it did. One AND input short while the other is neutral? The wires show it before you touch a debugger.
Strategy Development
From Indicator to Strategy
Without Writing Code
STRATEGY
Automate It: Your Pipeline as a Live Strategy
Add S-Condition, S-Proc, S-Gate, Entry, Exit, and Flatten blocks and Fusion Strategy turns your indicator design into a fully automated strategy. Runs through NinjaTrader® Strategy Analyzer for complete historical backtesting. Your logic runs natively inside NinjaTrader®: no webhook relay in the path, no bridge account, no external endpoint that has to be reachable and responding.
OPTIMIZE
Optimize It: Parameter Sweeps Without Code
Define parameter ranges for any block value and let NinjaTrader®’s Analyzer run all combinations. Find the best-performing configurations without editing code. Make a change, re-run, and iterate with Fusion Optimizer.
Risk Management
Risk Management at Two Levels
Per-strategy rules where you build. Account-wide monitoring where you trade.
1 · Per-Strategy Risk
These rules live inside your strategy design and travel with it, encoded in the same Template Key and evaluated by Fusion Strategy and the Optimizer.
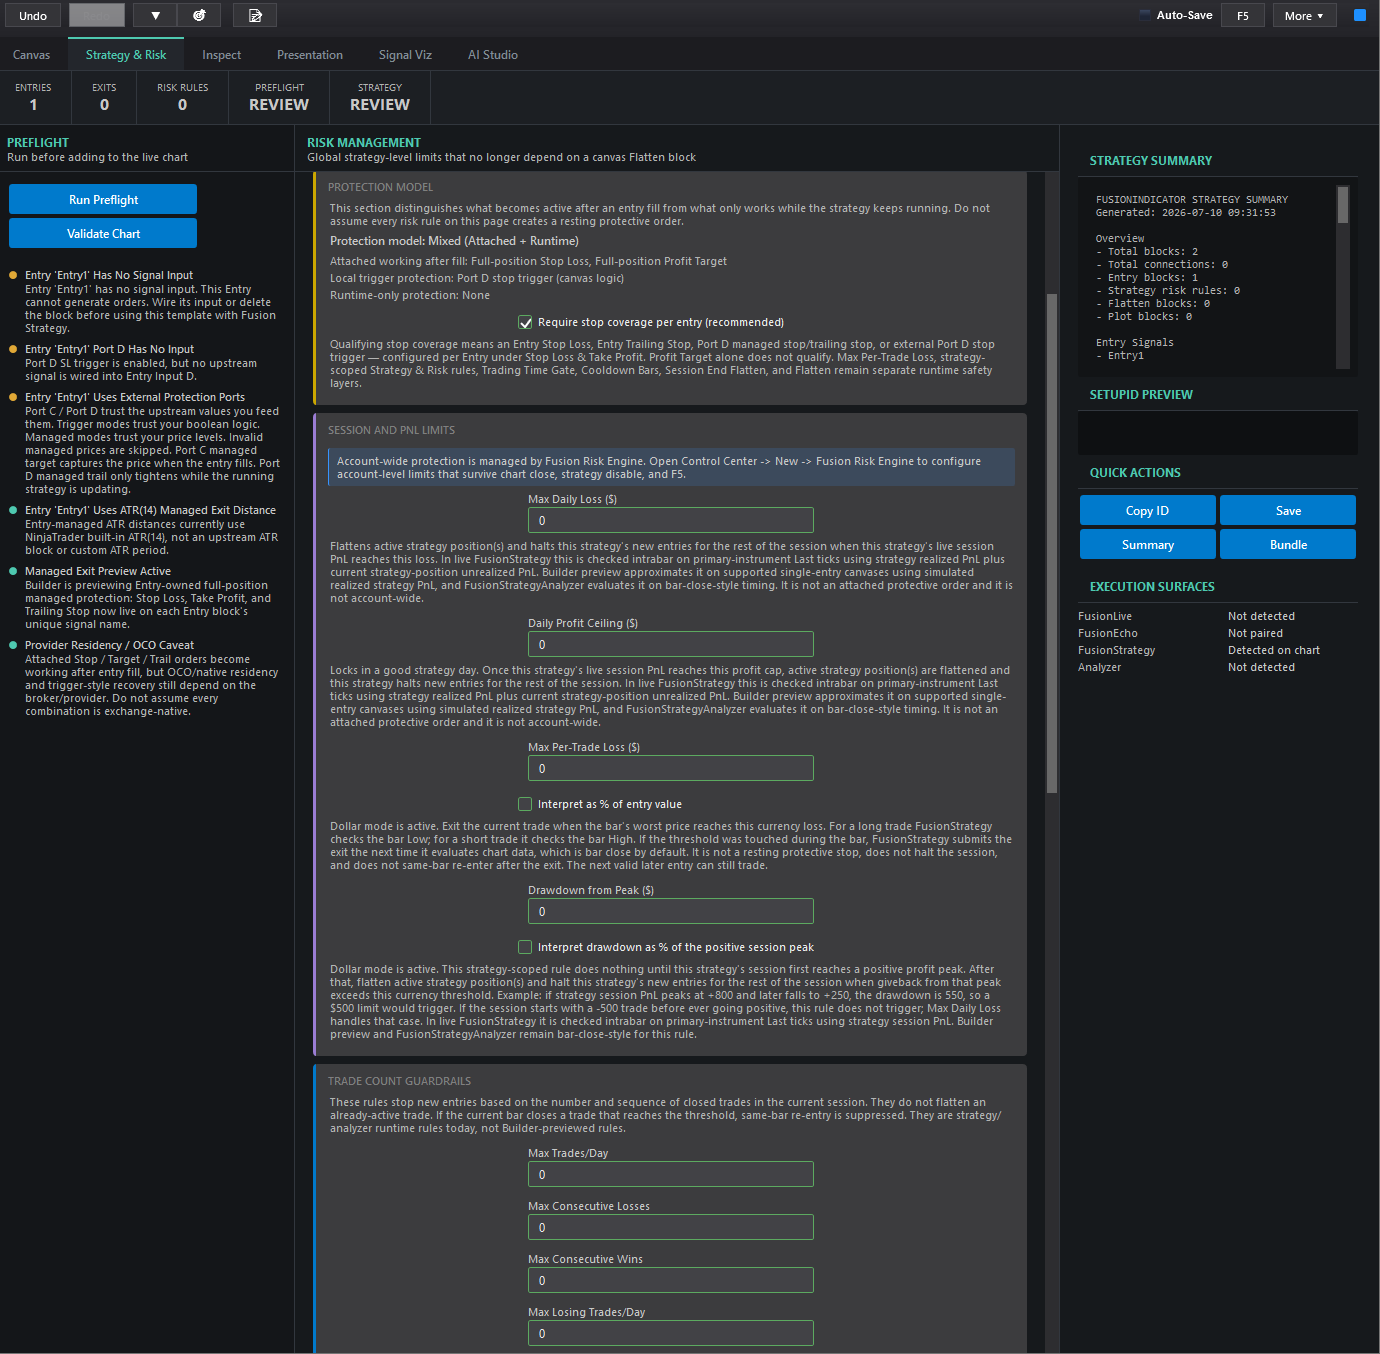
Strategy & Risk tab: global limits configured per strategy:
- Session P&L limits: Max Daily Loss, Daily Profit Ceiling, Max Per-Trade Loss (dollars or % of entry value), and Drawdown from Peak (dollars or %).
- Trade-count guardrails: max trades per day, max consecutive losses or wins, max losing or winning trades per day.
- Daily Watermark: a two-step profit-lock: arms when session profit reaches a level, then flattens on a set giveback from the post-arm peak.
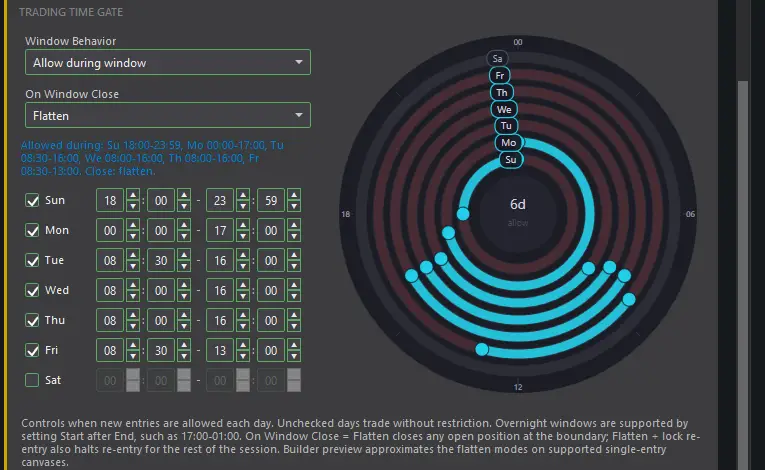
- Trading Time Gate: per-day trading windows with optional auto-flatten at the window edge and at session close.
A live Preflight panel checks your design first: unwired signals, missing stop coverage, provider/OCO caveats, before the strategy ever touches the chart.
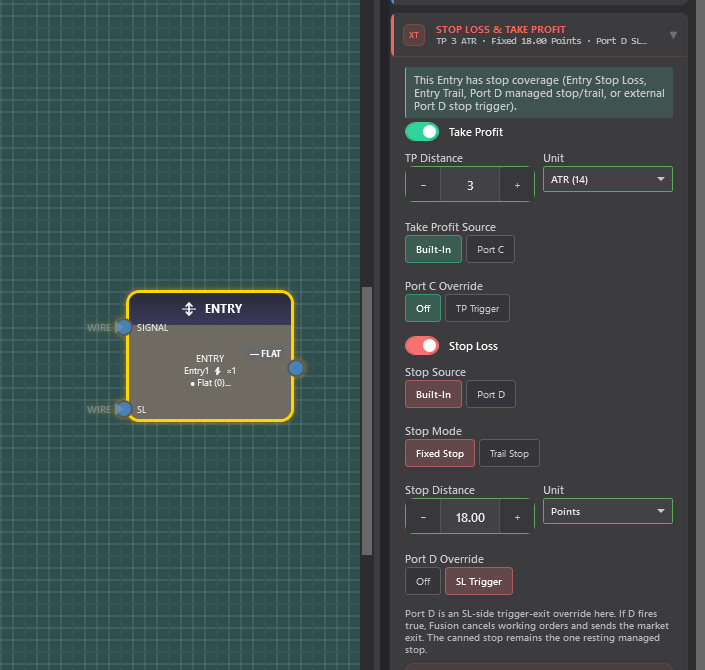
Entry-owned stops & targets: every Entry block carries its own protection:
- Take Profit and Stop Loss, each in ticks, ATR, percent, dollars, points, or price.
- Stop modes: fixed stop or trailing stop.
- Sources: built-in managed levels, or feed your own price through Port C (target) / Port D (stop).
- Port C/D can act as a managed price level or as a boolean trigger-exit you define in the pipeline.
Flatten block: a strategy-wide emergency flatten fired by any canvas condition you define through pipeline math: the emergency cord.
2 · Account-Wide: Fusion Risk Engine (included but optional)
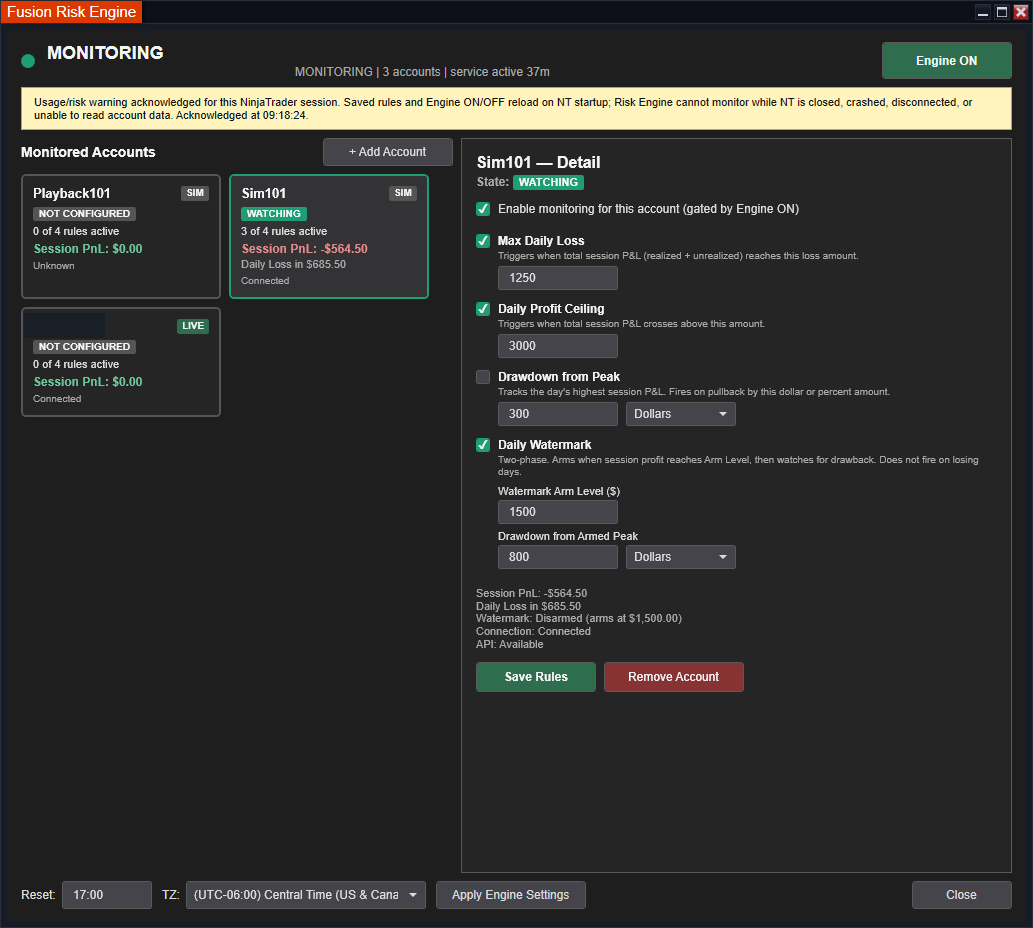
The Fusion Risk Engine monitors risk across your whole account, independent of any single chart or strategy, and it watches several accounts at once. Per account:
- Max Daily Loss and Daily Profit Ceiling.
- Drawdown from Peak (dollars or percent).
- A two-phase Daily Watermark: arm at a profit level, then flatten on drawback from the armed peak.
Fusion Strategy handles per-strategy risk; the Risk Engine watches the account.
Risk tools are configuration aids, not guarantees. Automation and prop-firm policies vary. Verify your own firm’s rules.